-
 Srap Tasmaner
5.2kHere’s a graph I’ve been thinking about:
Srap Tasmaner
5.2kHere’s a graph I’ve been thinking about:
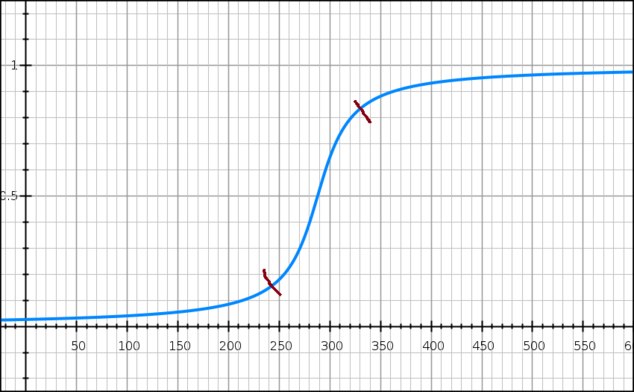
There are various ways of interpreting this. You could imagine induction working a bit like this, or any theory for which evidence is accumulated. I can see interpreting it either as a model of an individual’s degree of belief given evidence, or as the percentage of a population that holds a belief given evidence.
The idea is that at the far right end, each new observation or piece of evidence results in a smaller and smaller marginal increase in confidence, and something similar happens to the left. (One way to look at this is to say that the sections to the left and right are relatively invariant, compared to what’s going on in the middle.)
One use for it would be looking at heaps of sand. You could imagine the y-axis representing either the percentage of a population that says “heap” as you increase or decrease the number of grains of sand or as an individual’s degree of belief that a collection of a given size is a heap (i.e., willingness to apply the word “heap” to it). To the left and right of the red marks, each grain makes little difference; you're already pretty comfortable saying "heap" or "no heap".
Usually the problem of the heap is that there is no principled way to determine the saddle point of this graph. (Or, if you prefer a simple “yes/no”, no good way to choose the point at which the y-value should jump from 0 to 1.) That one I'm not addressing today.
But there’s another issue. The value of an individual grain of sand is noticeably larger between the two red marks. Our intuition is that one grain of sand more or less is always a small and uniform change. And similarly for observations supporting an inductive inference or a theory.
So this is peculiar. I find the basic idea behind the model pretty compelling, so I’m inclined to discard the intuition. Does that mean some observations are worth more than others, some grains of sand more than others?
I think this is an illusion. It’s the size of the collection of evidence (or grains) that matters. We think of the collection being built step-by-step over time, so that there is a period of time when we are valuing each new observation much more highly (max at the saddle point). That might actually be true, but not because the individual observation is more valuable, but because the size of the collection accumulated so far is in the crucial zone between the red marks.
There's still something odd about that zone in the middle. Any thoughts? -
 WISDOMfromPO-MO
753Could the peak at the right red mark and the leveling to its right be the soil where a Kuhnian paradigm shift is planted?
WISDOMfromPO-MO
753Could the peak at the right red mark and the leveling to its right be the soil where a Kuhnian paradigm shift is planted? -
WISDOMfromPO-MO
753The graph could reflect the process of evidence gathering rather than observers' marginal confidence in the evidence.
Kind of like assembling a jigsaw puzzle. As more pieces are placed in their home the process of identifying the home of pieces accelerates and then peaks. -
 Metaphysician Undercover
14.9kAssuming that the graph is as much a temporal layout as it is numerical, the beginning (left), is a time when the evidence is not viewed as evidence. No one knows the meaning of the grains of sand, and at first no one is interested The grains of sand keep coming in, but no one is thinking that the sand is making a heap, so it is not considered as evidence of a heap. The centre part of the graph is when the piling up of the sand becomes important. This is a time of theory and speculation. Therefore the grains of sand are viewed as evidence of something, at this time, and there is active and rapid thought as to what is going on, "evidence of what?". Once it is established that there is a "heap", the grains of sand keep piling up to very little notice as the existence of "the heap" is now taken for granted.
Metaphysician Undercover
14.9kAssuming that the graph is as much a temporal layout as it is numerical, the beginning (left), is a time when the evidence is not viewed as evidence. No one knows the meaning of the grains of sand, and at first no one is interested The grains of sand keep coming in, but no one is thinking that the sand is making a heap, so it is not considered as evidence of a heap. The centre part of the graph is when the piling up of the sand becomes important. This is a time of theory and speculation. Therefore the grains of sand are viewed as evidence of something, at this time, and there is active and rapid thought as to what is going on, "evidence of what?". Once it is established that there is a "heap", the grains of sand keep piling up to very little notice as the existence of "the heap" is now taken for granted. -
Srap Tasmaner
5.2kCould the peak at the right red mark and the leveling to its right be the soil where a Kuhnian paradigm shift is planted? — WISDOMfromPO-MO
I don't think so. I think this model is purely internal, whereas my dim memory of Kuhn was that he's looking at external factors too.
The graph could reflect the process of evidence gathering rather than observers' marginal confidence in the evidence. — WISDOMfromPO-MO
I would guess this would follow more of a bell curve -- if we did time along x and evidence gathered on y -- like most projects: slow startup, fruitful middle period, and then less and less evidence gathering since the induction is more or less established.
Kind of like assembling a jigsaw puzzle. As more pieces are placed in their home the process of identifying the home of pieces accelerates and then peaks. — WISDOMfromPO-MO
Hmmm. The percentage of the puzzle completed would be linear to each piece placed.
As for the speed of placing pieces, I'm not sure. It seems like it would start slow and accelerate until you're done, but there are usually distinct phases: sorting, building the edge, then assembling chunks, etc. (There's at least one on the market calling itself "the world's hardest" that has no edges and a few extra pieces -- yikes!)
Very nice post. I think this gives a good feel for what might go on in the crucial middle zone.
I worried after I posted that maybe it should be flattened a bit, instead of being so dramatic, but I wonder if the dramatic shift isn't better after all ...
Hey thanks @WISDOMfromPO-MO for your thoughts. Sounds like the sort of thing you've already devoted some thought to. -
Srap Tasmaner
5.2kThe percentage of the puzzle completed would be linear to each piece placed. — Srap Tasmaner
True, but the marginal increase in the percentage of the puzzle finished does get smaller. Forgot about that. -
Srap Tasmaner
5.2k
Apologies -- I thought your post was another from @WISDOMfromPO-MO.
Anyway, your description is appealing.
(Btw, I hope it's obvious to you why I'm thinking about this.) -
Metaphysician Undercover
14.9kI worried after I posted that maybe it should be flattened a bit, instead of being so dramatic, but I wonder if the dramatic shift isn't better after all ... — Srap Tasmaner
I think the dramatic middle zone is called for. When an issue attracts our attention, and becomes important, there develops a sense of urgency for resolution. Prior to, and posterior to that urgency, the issue just kind of hangs around. The time when we're paying attention to it is a short slice of its overall temporal existence. -
 apokrisis
7.8kThere's still something odd about that zone in the middle. Any thoughts? — Srap Tasmaner
apokrisis
7.8kThere's still something odd about that zone in the middle. Any thoughts? — Srap Tasmaner
Did you mention that exactly halfway is where the rate of increase peaks, so is also exactly where the rate of decrease first starts?
The middle section of a logistic function only looks odd in the sense that we can't really see much going on in terms of big change, but a big causal-level change is happening. Naked growth is giving away to constrained growth.
And while models of growth within limits might make you think that one more, or one less, can't be a big deal, a more accurate modelling of a sand pile would probably be one that includes system correlations (the drag of global limits) from the start. So the kind of non-linearity that explains phase changes, like where water turns to ice once some threshold between molecular thermal jitter vs inter-molecular electrostatic forces is breached.
With the Sorites sand pile, we are basically asking when the emergent global property of "acting like a pile" appears. And that requires some dynamical definition. A pile should be some heap that has some characteristic global cohesion. Shaking it about or adding more stuff shouldn't change its basic mathematical form. It would still look the same in whatever critical way you think defines a pile.
So adding or subtracting a grain of sand to a box of sand doesn't really make any difference until the box is actually full. And that is what your intuition tells you when viewing a logistic growth function because you are not thinking about any critical shift in the rate you are able to add or subtract those grains.
But if you are instead thinking about a sand pile as having globally cohesive behaviour that emerges once there is a sufficient weight of inter-grain correlations to outweigh a matching weight of individual sand grain freedom, then single grains do start to make a clear difference at the critical threshold of any such phase change. There comes a point where the whole first started to be greater than its parts. -
 Mongrel
3kThere's still something odd about that zone in the middle. Any thoughts? — Srap Tasmaner
Mongrel
3kThere's still something odd about that zone in the middle. Any thoughts? — Srap Tasmaner
It's reflecting an odd scenario. I'm dropping grains of sand and asking "Is it a heap now?" Performance art.
I think it would be more common for me to say "Sweep up that heap of sand, please." However much sand is there magically becomes a heap. Or am I totally missing your point? -
Srap Tasmaner
5.2kDid you mention that exactly halfway is where the rate of increase peaks, so is also exactly where the rate of decrease first starts? — apokrisis
max at the saddle point — Srap Tasmaner
Not exactly, and thanks for this clarification:
single grains do start to make a clear difference at the critical threshold of any such phase change — apokrisis
And big thanks for telling me what this is! I just made this up. I didn't know this is called a "logistic function." (Was hoping you'd come along with info like this.) -
WISDOMfromPO-MO
753But there’s another issue. The value of an individual grain of sand is noticeably larger between the two red marks. Our intuition is that one grain of sand more or less is always a small and uniform change. And similarly for observations supporting an inductive inference or a theory. — Srap Tasmaner
Evidence does not just tell us what is true/real, it tells us that everything else is not true/real.
In a murder investigation if it is known that the cause of death was stabbing then it is known that it was not strangling, a gunshot, poisoning, etc. If it is later determined that the stab wounds are from a kitchen knife then it is known that they are not from a pocket knife, scissors, etc. Each instance of such differentiating increasingly rules out suspects, scenarios, etc.--each new grain of sand tells us more than any previous individual grain of sand did.
But can't you imagine a point of diminishing marginal returns where new evidence only confirms previous evidence? If you know that the killer was at least 7 feet tall, and you know that no woman in your small community is that tall, are DNA lab results showing that the killer was a man going to make you feel like you are even closer to handing the case off to the DA's office or are they going to turn your attention in a different direction where doubts (do we have the right man?) are likely to be entertained? See how new grains of sand might suddenly start to be worth less? -
Srap Tasmaner
5.2k
I agree with a lot of this, and the way it works over time, as a model of our process of discovery, is compelling. But grains of sand are interchangeable, as are black ravens, and it cannot matter in what order you add them to a pile or examine them.
My start at a solution was not to look at the graph as adding one grain of sand at a time, but just as a relation between our willingness to say "heap" and the total number of grains in the collection so far. That's fine, but I have no real explanation for why things are so volatile in the middle except that they have to be for us to get from almost-certainly-not-heap to almost-certainly-heap. @apokrisis does have a positive characterization of those collections in the middle: they're the ones most sensitive to the addition or removal of a grain or a small number of grains, that are just beginning to show heapness or just losing it. If our concept "heap" is tracking the natural heap-process he describes, then we're all good, I guess. But what about other vague concepts like "tall"? Same thing?
I don't know what to say about induction though.
It also looks like this sort of model breaks down with highly variable pieces of evidence, but maybe the idea would be to weight each piece of evidence. For instance, if one of the first things you discover in your investigation is that the unsub was a man, that might move you pretty far along the curve. That's a big fat grain of sand that eliminates half the population. You'd need a way to do the weighting, and that could be interesting. You could imagine a really crucial piece of evidence pushing you right along from the left red mark all the way to the one on the right. Cool.
It doesn't help us with induction though -- no weighting there -- but it's nice that we might be able to preserve it as a general model of partial belief, with tinkering.
Thanks for coming back @WISDOMfromPO-MO! -
Srap Tasmaner
5.2kI think this does make sense as a model of partial belief, for at least some cases, but I'm still not sure why. One approach might be to follow @apokrisis's lead and just conclude that belief follows the same sort of natural growth pattern as lots of other things. A journey from hunch to habit.
We have a clear enough idea what the independent variable for induction would be -- and I think a sort of Humean linking of induction and habit might be appropriate here -- but what about other things?
One possibility is, besides evidence, connections to other beliefs. If we imagine a new candidate belief being gradually woven into your web of beliefs, it becomes plausible to imagine an accelerating process of interdependence that could push a well-enough supported belief, one for which there was enough evidence to get it to the left red mark, through the transition zone and into full acceptance and integration into your theory (or belief system or conceptual scheme, whatever). -
 SophistiCat
2.4kI didn't know this is called a "logistic function." — Srap Tasmaner
SophistiCat
2.4kI didn't know this is called a "logistic function." — Srap Tasmaner
Or the error function (different function, similar shape). There are a number of such functions, collectively known as sigmoid functions.
As for the sorites paradox, I think the whole point of it is that it cannot be resolved like the Ravens paradox, using the subjective degree of confidence model of belief formation, where, in the straightforward Bayesian analysis, belief is represented by a single, continuously evolving real-valued variable. And the reason is simply that there is no sharp and precise fact of the matter to be located here. The "paradox" comes from the tension between the demand, urged by the framing of the problem and prompted by our familiarity with analysis, for a precise numerical solution - and the intuitive realization that no such solution will be satisfactory.
This actually applies to the Ravens paradox and other such paradoxes of belief as well, though perhaps not as acutely as in the case of the sorites paradox. The Bayesian solution is a neat one, it seduces us with its mathematical elegance, but it is not a perfect fit to our intuitions, nor, in all honesty, should we expect it to be.
Our problem here is the fallacy of misplaced concreteness. When given a problem, we habitually reach for familiar conceptual tools - in this case mathematical analysis - without giving sufficient critical attention to the nature of the problem. This is fine when solving practical problems, which often dictate the use of a particular toolset and the production of a particular kind of result. For example, if you were to conduct a survey, presenting different people with different quantities of sand, the distribution of answers as a heap/pile percentage vs. the amount of sand might look something like a sigmoid curve (though it will probably be a different curve in different language communities).
But when the question is no longer about ticking off this or that checkbox on a clipboard and summing up results - when it is something as messy, ambiguous and fluid as a "belief" - why would you expect the answer to be in this definite numeric form? Why would you expect there being the answer in the first place? Do you really think the true nature of a "belief" is a simple mathematical function (preferably one already familiar to us from solving practical problems)? Do you think that "belief" even has a true nature? -
Srap Tasmaner
5.2k
I'm largely going to be defending myself here, but don't take that as meaning I don't I appreciate your critique!
So there are two main points: I have misunderstood the sorites paradox, and I am committing the fallacy of misplaced concreteness by attempting to analyze belief numerically.
Sorites
And the reason is simply that there is no sharp and precise fact of the matter to be located here. The "paradox" comes from the tension between the demand, urged by the framing of the problem and prompted by our familiarity with analysis, for a precise numerical solution - and the intuitive realization that no such solution will be satisfactory. — SophistiCat
I'm starting from the observation that away from the transition zone, there is relative stability. Each increase in the size of the heap produces a diminishing marginal increase in willingness to say "heap". At the other end, each decrease produces a decreasing marginal decrease in willingness to say "heap". Something happens in the middle, which we'll get to in a minute.
I think it's noticeably less controversial if you imagine this representing a population rather than an individual. We expect there to be thresholds above and below which people mostly agree, and it's in the middle that there's controversy. If you graphed their disagreement amongst themselves instead, you'd get a normal distribution.
Just going by that, you'd conclude that people are not inclined to agree on where the saddle point of this graph should be. That's one sense in which no solution can be satisfactory. You and your neighbor will make different choices and it's not clear on what grounds consensus could be built. But for all that, you and your neighbor mostly agree.
Now let's look at an individual. There are the outer sections where she's pretty certain what to say, and the middle section where she's not. What is she to do in the middle? On what grounds could she possibly decide when to say "heap"? One thing we could say is that the framing of the problem, as you say, forces her to choose. And she can, even if arbitrarily.
As above, we could graph her uncertainty about her answer instead, and we'd expect a normal distribution, wouldn't we? And if we say that one way of measuring the satisfactoriness of an answer is the confidence we have in it, then yes, her choice of saddle point will be unsatisfactory. But having chosen, she can stick to that choice consistently.
Belief
But when the question is no longer about ticking off this or that checkbox on a clipboard and summing up results - when it is something as messy, ambiguous and fluid as a "belief" - why would you expect the answer to be in this definite numeric form? — SophistiCat
I should say, first, that for me "belief" is practically a theoretical entity, it's just that the theory is plain old folk psychology. Beliefs are the sorts of things we act on, including, for instance, by making assertions. We impute beliefs to others based on their behavior, including what they say. I'm not interested here in our phenomenological experience of belief, which may well be messy, ambiguous and fluid.
We also routinely talk about degrees of partial belief. Though that's usually pretty loose, it can sometimes be more precisely quantified. Gambling, of course, is the paradigm for this.
All of which brings us back to consistency. Insofar as we aspire to rationality, and expect it of others, we strive for consistency in our beliefs. And consistency is not restricted to certainties; our partial beliefs can also be consistent or inconsistent. What matters for consistency is not so much the specific numbers, but ordering your beliefs as more and less certain.
One thing this curve could represent is an individual striving for consistency under conditions of irreducible uncertainty.
I'm explicitly not "solving" the sorites problem. I'm just interested in how partial belief works, and I keep finding reasons to expect individuals and populations to be homologous.
For instance, this curve can also represent the uptake of a new word within a population. For an individual, it could represent his willingness to use the word and his expectation of being understood. The acceleration we see in the middle makes perfect sense here: as more people adopt the new convention, there is increasing social pressure on individuals to follow suit, and increasing willingness of individuals to use the word because they can expect to be understood.
That feedback loop we find with conventions provides an explanation for what happens in the transition zone. The sorites is a tougher case, which is one reason I posted. -
SophistiCat
2.4kThanks, I mostly agree with you.
Sorites
[...]
I think it's noticeably less controversial if you imagine this representing a population rather than an individual. — Srap Tasmaner
Yes, here the interpretation of the model is clear and the model may be a good fit (to that interpretation). Or is it? If the middle section is where people are genuinely uncertain about their choice, the actual distribution of answers may break down into random noise.
As above, we could graph her uncertainty about her answer instead, and we'd expect a normal distribution, wouldn't we? — Srap Tasmaner
Does the statistics (if there is in fact a consistent statistics) of individual choice represent one's degree of confidence/uncertainty? If we define it behaviorally, as you say later, then it does so, by definition. But then reporting observed behavior as the degree of uncertainty is merely tautological: despite the use of an ostensibly psychological term, this does not shed any light on our inner world. But if the assertion is that the graph represents phenomenal uncertainty (which is, after all, the central thesis of epistemic/Bayesian probability interpretation), flattening out a mess of thoughts, feelings and subconscious processes into one number, then it is much less certain (as it were).
I guess my uneasiness goes back to bridging the gap between probability and a single case. Unlike mathematical probability, real-world probability is always single-case (we don't deal with infinite ensembles!) Defining probability as a frequency is unsound for that reason, while defining it epistemically threatens to oversimplify a complex psychological phenomenon. The moral, I think, is to treat Bayesian models of behavior with caution. When you blow up a detail of a curve and ask about its physical meaning, always keep in mind the possibility that it may not have one: it may just be a modeling artefact.
One thing this curve could represent is an individual striving for consistency under conditions of irreducible uncertainty. — Srap Tasmaner
Yes, that's the Dutch Book argument, and I do find it rather compelling. (And notice how you have switched from behavior to phenomenology, after all!) Don't get me wrong, I like Bayesianism. I like it for its mathematical elegance, consistency, and (when used correctly), instrumental usefulness. When it comes to modeling uncertain beliefs and decisions, it is probably the best game in town.
I'm just interested in how partial belief works, and I keep finding reasons to expect individuals and populations to be homologous. — Srap Tasmaner
Well, one reason for that may just be that the curve, assuming it is the error function, is closely related to the normal distribution, which is ubiquitous whenever you deal with (or assume) random variables.
There may also be an evo-psych story here: the reason individual is homologous with population is because cognition is an evolved feature, and evolution works on populations. The behavioral strategies that statistically increased the population fitness were the ones that were fixed in our genes. This may also serve to explain away the problem of induction: the reason we intuitively trust induction is that our environment does have certain regularities (how could it not? we wouldn't be here if it didn't), and we have adapted to recognize and exploit those regularities. -
Srap Tasmaner
5.2k
Wow. This is incredibly helpful.Many many thanks.
If the middle section is where people are genuinely uncertain about their choice, the actual distribution of answers may break down into random noise. — SophistiCat
Agreed.
Actually, what I thought most likely was that the zone between the red marks is where an individual, if allowed, is likely to say "I'm not sure," or "Leaning 'heap'" or "Leaning 'not heap'", that sort of thing. I picked out the red points as where I imagined confidence reaching a point where an individual might be comfortable committing on each end. I aimed for the points at which the rate of change is 1, but I'm not sure why, and I'm not sure what the mathematical significance of those points is.
When you blow up a detail of a curve and ask about its physical meaning, always keep in mind the possibility that it may not have one: it may just be a modeling artefact. — SophistiCat
That was exactly my worry coming in -- the outer sections of the curve came first for me, starting from the red marks, and then the middle is just what connects them. Obviously, there are an awful lot of ways to connect to the two sections, but this is the "natural" way, so I wanted to see if the natural way of filling the curve could be made sense of. If not, I consider that a problem.
Well, one reason for that may just be that the curve, assuming it is the error function, is closely related to the normal distribution, which is ubiquitous whenever you deal with (or assume) random variables. — SophistiCat
RIght -- I have to study a bit. I only know (so far) the statistics I learned to obsessively analyze baseball.
Maybe this is the point to say that I know very little about Bayesian analysis -- I always had a prejudice against it. But various factors have moved me into orbit around planet Bayes. I had just started reading Ramsey's "Truth and Probability" when I posted this. Following Ramsey, I got to this curve entirely as a matter of logic, rather than statistics. (All the consistency talk comes from Ramsey.) At any rate, away team beaming down soon ...
Does the statistics (if there is in fact a consistent statistics) of individual choice represent one's degree of confidence/uncertainty? If we define it behaviorally, as you say later, then it does so, by definition. But then reporting observed behavior as the degree of uncertainty is merely tautological: despite the use of an ostensibly psychological term, this does not shed any light on our inner world. — SophistiCat
This is terribly astute.
Under the influence of Lewis's Convention, I've been experimenting with "economic" approaches, which includes a methodological individualism. (And hoping to justify that by the "homology" I mentioned.) It was congenial to me to follow Ramsey's lead here -- despite my lingering resistance to pragmatism -- because of how I got here: what I'm really aiming at is assertion, but assertion conceived as a way of acting upon a belief. So it's behavior I was after from the start, a specific sort of behavior which has an obvious connection to belief. (Is there a threshold below which you don't assert, and one above which you do? Are reasons for belief automatically reasons for asserting, or are they different sorts of things? etc. etc.)
And indeed I am not particularly interested in shedding light on our inner world, though, oddly perhaps to some, I am extremely interested in rationality. My interest in "belief" is related not just to behavior, but to beliefs as something we reason about. I had not approached it this way before, but if what we reason about turns out to be that which could count as a reason for acting (drifting further into pragmatism), then so be it. At least I get to keep following the economic approach which I find pretty compelling, though no doubt this is the enthusiasm of the convert.
This may also serve to explain away the problem of induction — SophistiCat
Interesting speculation here, which I'm not quite ready to deal with.
Once I knew that what I'd come up with was a sigmoid curve, I could investigate a little, and they are used to model some of the phenomena I expected.
But I have found almost nothing on how induction is modeled. Am I way off base even including induction here? It's very suggestive that the logistic curve is a natural way to model the process of a concept becoming entrenched in a population, and that's where Goodman's analysis of induction lands.
The issue with induction really comes down to your confidence in the inductive inference, and there are so many ways to measure that statistically. (I have so much to learn.) Back before I started this, I heard an interview with Brian Nosek on the radio, and he explained that his main tool for spotting questionable research was comparing effect sizes to population sizes (with unfortunate results). I've been wondering if maybe the transition zone on my curve is where the population size begins to be large enough to justify the observed effect size (if I'm getting that right). From the point of view of the researcher, the whole section to the left is where you keep chanting to yourself, "small sample size, small sample size." But as you near the saddle point, things are starting to get real.* I think this is what the sabermetrics crowd talks about as stabilization.
Am I in the neighborhood of understanding this?
* Footnote added. Perhaps the more accurate term here would be "cromulent".


Welcome to The Philosophy Forum!
Get involved in philosophical discussions about knowledge, truth, language, consciousness, science, politics, religion, logic and mathematics, art, history, and lots more. No ads, no clutter, and very little agreement — just fascinating conversations.
Categories
- Guest category
- Phil. Writing Challenge - June 2025
- The Lounge
- General Philosophy
- Metaphysics & Epistemology
- Philosophy of Mind
- Ethics
- Political Philosophy
- Philosophy of Art
- Logic & Philosophy of Mathematics
- Philosophy of Religion
- Philosophy of Science
- Philosophy of Language
- Interesting Stuff
- Politics and Current Affairs
- Humanities and Social Sciences
- Science and Technology
- Non-English Discussion
- German Discussion
- Spanish Discussion
- Learning Centre
- Resources
- Books and Papers
- Reading groups
- Questions
- Guest Speakers
- David Pearce
- Massimo Pigliucci
- Debates
- Debate Proposals
- Debate Discussion
- Feedback
- Article submissions
- About TPF
- Help
More Discussions
- Why do atheists ask for evidence of God, when there is clearly no such evidence?
- Objective evidence for a non - material element to human consciousness?
- What evidence could we have that things really are as they seem when that's all evidence is?
- Do these 2 studies show evidence that we live in a simulation or a hologram?
- Other sites we like
- Social media
- Terms of Service
- Sign In
- Created with PlushForums
- © 2026 The Philosophy Forum